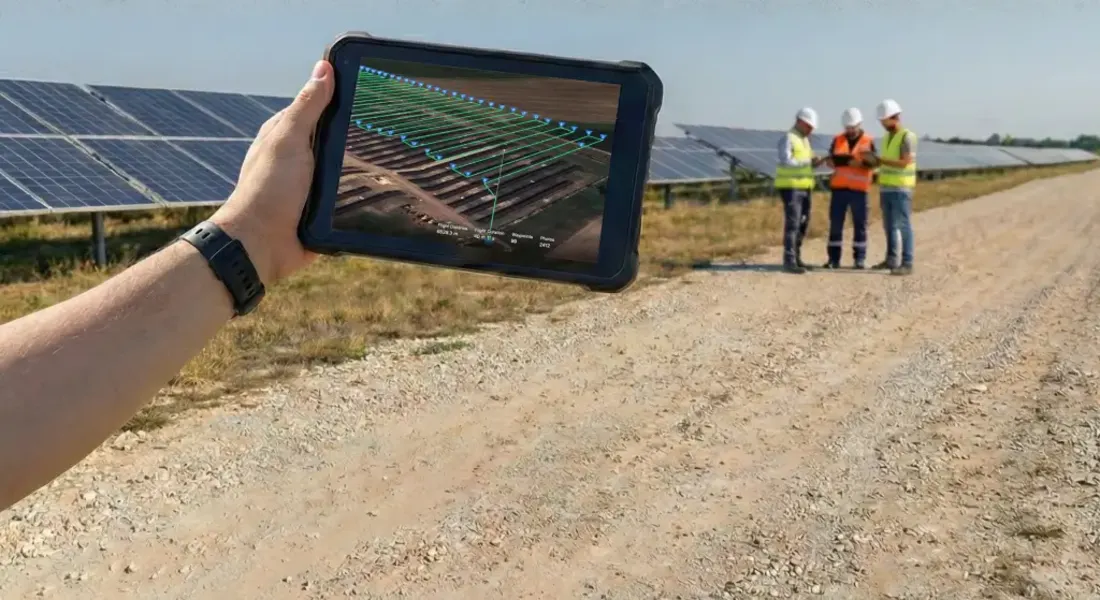
Based on the founder’s field experience, we typically identify 5–17% production-improvement potential, including several percent at regularly inspected farms.
An experience-based range, not an independently audited performance guarantee. Realised output depends on the faults found and repairs completed.What could this mean nationwide? ↓
An image of a solar farm is the starting point. TerraSky combines proprietary image processing with engineering analysis to identify lost production and the work needed to recover it.
Beyond the obvious faults.
RGB and thermal images, panel-level identification and site data work together to reveal losses that a basic visual inspection cannot explain. In the founder’s experience, deeper analysis brings entire additional categories of fault into view.
Useful on the next working day.
Outputs locate the fault, describe it and estimate the associated loss. That supports priorities and an actionable task list, backed by maps and panel-level documentation for the field team.
See from the air. Measure on the ground.
Regular site measurements complement drone surveys. Y’s Proxima project is a sensor development connected to TerraSky, adding environmental context to what the images show.
HUNGARY / 2025A COUNTRY-SCALE OPPORTUNITY
What if we could see every solar farm?
A survey every two years. Repairs completed. Just 5% recovered production. Let’s examine the annual value this could create across Hungary.
MEASURED ANNUAL SOLAR OUTPUT6.81 TWhHungary · public net generation
5% · base case17%
ANNUAL GROSS MARKET VALUE OF EXTRA OUTPUT
21.25million EUR
≈ 8.45 billion HUF / year
+340,584 MWh / year
5% assumption. The monthly table shows the 5% base case.
This is an illustrative gross value opportunity, not a guaranteed return or net national saving. Survey, repair and financing costs have not been deducted.
TIMING MATTERS
Solar does not earn the annual average price.
Supply is high and prices are often low on summer afternoons. We therefore matched every 15-minute generation interval to its day-ahead market price. Negative-price periods are included.
108.51EUR/MWh annual time-weighted market average
62.38EUR/MWh solar-generation-weighted price
Two different monthly average prices EUR/MWh
Market averageSolar-weighted
☀
Two sides of a summer day. 13:00 → 21.16 EUR/MWh.20:00 → 198.37 EUR/MWh. Average prices in those hours across June–August. We did not value daytime output at the higher evening price.
The calculation, month by month 2025 · 5% base case
Month
Solar outputGWh
Market averageEUR/MWh
Solar-weighted priceEUR/MWh
Gross value of 5%thousand EUR
Jan
195.8
140.19
123.29
1,207
Feb
379.6
158.88
127.99
2,429
Mar
539.8
109.02
67.13
1,812
Apr
728.9
85.46
40.31
1,469
May
749.6
80.89
35.17
1,318
Jun
983.9
84.10
39.05
1,921
Jul
896.3
102.56
71.67
3,212
Aug
855.3
80.51
41.55
1,777
Sep
619.0
101.93
61.66
1,908
Oct
484.1
122.03
91.40
2,212
Nov
238.8
124.35
104.03
1,242
Dec
140.6
115.88
105.10
739
Full year
6,811.7
108.51
62.38
21,246
Open calculation. Clear assumptions.+
How we calculated it
Σ (MW × 0.25 h × EUR/MWh) × 5%
35,040 quarter-hour generation observations cover the full year. Hourly, then quarter-hourly prices are matched to their effective intervals. The 5% uplift follows the observed generation profile.
We assume that identified faults are repaired and the production benefit persists between surveys. The value then accrues annually; it is not halved merely because surveys occur every two years. Initial nationwide rollout timing is not modelled.
Model boundaries
The source measures public net electricity generation, not all household self-consumption. 5% is the lower end of the stated 5–17% experience range, but nationwide availability is not established. Grid restrictions, price effects of extra supply and changes in imports are not modelled.
Data sources and our processing · Fraunhofer ISE Energy-Charts / ENTSO-E; price data: Bundesnetzagentur | SMARD.de, CC BY 4.0; ECB annual average reference exchange rate.